Buyers Return as Coachella Valley Home Sales Climb
The Hamilton Real Estate Group July 15, 2026
The Hamilton Real Estate Group July 15, 2026
Summer has brought a renewed sense of energy to the Coachella Valley market. Buyers who sat on the sidelines through the spring are stepping back in, and sales activity is picking up meaningfully compared to a year ago. At the same time, inventory is tightening and pricing has softened just enough to reward well-informed buyers without spooking sellers. Homes are also taking a bit longer to find the right match. Read on for the full picture on sales, pricing, days on market, and which cities are leading the charge this month.
The Coachella Valley saw 571 homes sold in June, up 1.6% from May's 562 and11.3% higher than the 513 sold in June 2025. That year-over-year jump signals real buyer momentum returning to the valley after a slower spring. June's total was also the strongest month of the year so far. For a market that's seen inventory pull back, sustained sales growth like this points to steady, healthy demand rather than a one-month blip.
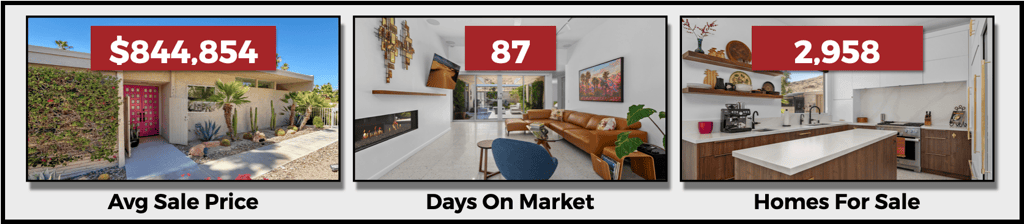
Active listings fell to 2,958 in June, down 14.4% from May's 3,456 and down 19.6% from the 3,681 available a year ago. That's the tightest inventory picture we've seen recently. With fewer homes to choose from and sales holding steady, buyers are competing for a narrower pool of options. Sellers with well-priced, well-presented homes should find a more receptive audience than they might expect given all the recent talk of a buyer's market.
June's median sale price came in at $575,000, down 2.1% from May and 4.2% below June 2025's $600,000. Average sale price landed at $844,854, down 7.7% from May but nearly flat year-over-year, off just 1% from $853,360. The gap between the two measures suggests fewer high-end sales closed in June relative to May, not a broad decline in value. Taken together, this looks like a market finding its footing rather than one losing ground.
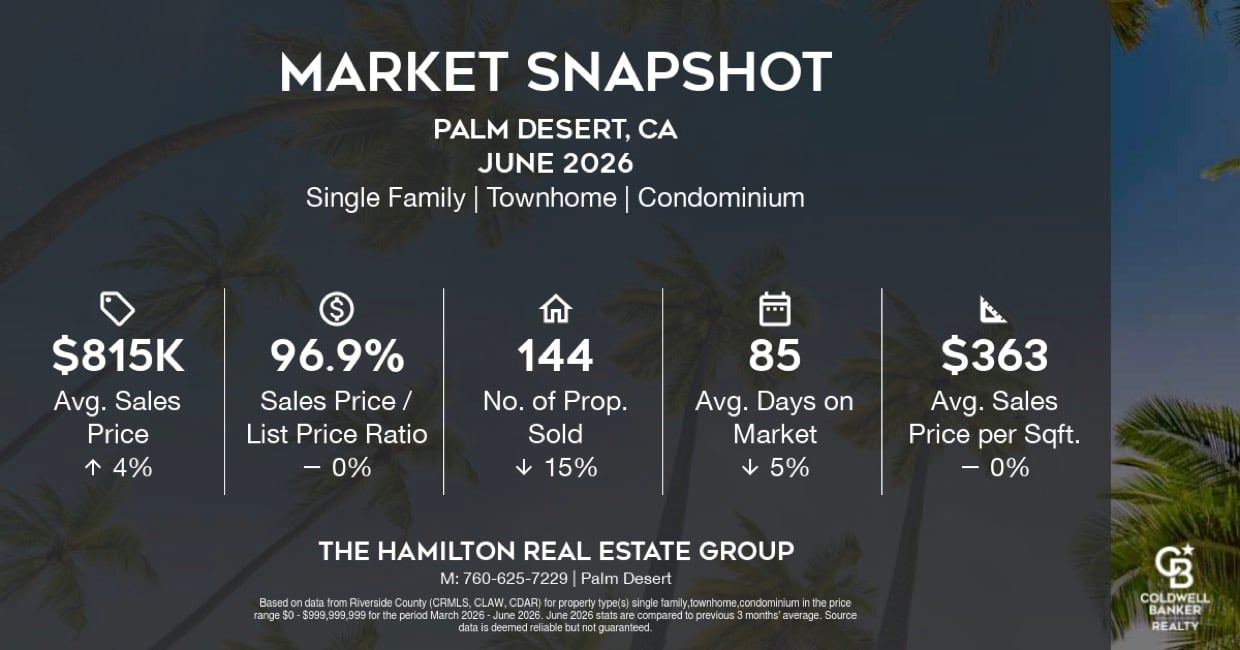
Price per square foot came in at $366 in June, down 3.9% from May's $381 and down 2.1% from $374 a year ago. Because this figure strips out distortions from home size and product mix, it's a cleaner read on true value trends than median or average price alone. The modest year-over-year softening lines up with the broader story this month: values have leveled off after last year's run-up, giving buyers a bit more room to negotiate.
Homes spent an average of 87 days on market in June, down 5.4% from May's 92 but up 8.75% from 80 days a year ago. That year-over-year lengthening is the more telling number. Buyers are taking more time to decide, and sellers need to price accordingly from day one rather than testing the market with an aspirational number. Homes that are priced right out of the gate are still moving; those that aren't are sitting longer than they did last summer.
The sale-to-list price ratio held steady at 97%, unchanged from both May and June 2025. That consistency tells us pricing hasn't slipped even as other numbers have shifted. Sellers who price at market value are still getting close to their asking price. This is a market where accurate pricing gets rewarded and overpricing gets punished with extra days on market, not a market where anyone should expect a bidding war to bail out an aggressive list price.
New listings totaled 741 in June, down 16.9% from May's 892 and down 10.6% from 829 a year ago. The pipeline of fresh inventory is shrinking even as sales pick up, which explains why active listings have fallen so sharply. Unless new listings rebound, buyers should expect the already-tight selection to stay tight through the rest of summer, and sellers weighing whether to list now or wait should recognize that competition from new inventory is currently limited.
This is a market that rewards buyers who move with intention. Inventory has thinned out and new listings are slowing, so the right home may not stay available long once it hits the market. At the same time, softer price-per-square-foot numbers and a longer days-on-market trend mean there's real room to negotiate on homes that have been sitting. Get pre-approved, know your target neighborhoods, and be ready to act quickly on well-priced new listings while still pushing back on anything that's overpriced or stale.
Pricing accuracy matters more than ever this month. The 97% sale-to-list ratio shows buyers are still willing to pay close to asking, but only when the number is right from day one. With days on market up year-over-year, an aspirational list price will simply sit and season, costing you leverage. This can be a great time to list your home for sale as sales volume is up sharply and inventory is tight. Well-prepared, well-priced homes are still moving. Prepare your home to show its best, and price to sell rather than to test.
Mortgage rates ticked up slightly this week. The 30-year fixed averaged 6.6%, up from 6.5% a week earlier, while the 15-year fixed rose to 5.8% from 5.7%. Jumbo 30-year loans, common for higher-priced Coachella Valley properties, averaged 6.8%. Rates remain in the mid-6% range that's held for much of the year, well off the highs of recent memory but still a meaningful cost factor for buyers at the top of their budget.
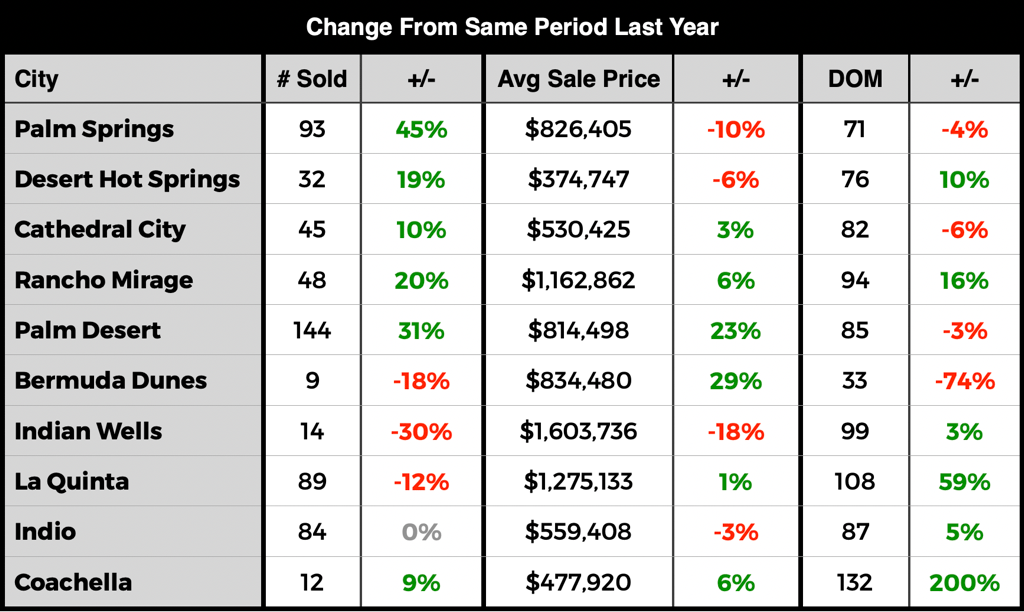
Palm Springs led the valley with sales up 45% year-over-year, followed by Palm Desert at 31% and Rancho Mirage at 20%. Desert Hot Springs and Cathedral City also posted solid double-digit gains. On the softer side, Indian Wells sales fell 30% and La Quinta dipped 12%, though both are lower-volume luxury markets where a handful of transactions can swing the percentage significantly. Indio held essentially flat.
Palm Desert's average sale price jumped 23% year-over-year, and Bermuda Dunes climbed 29%, though Bermuda Dunes sees so few transactions each month that a shift toward larger homes can easily produce a swing like that. Rancho Mirage rose a steadier 6%. Palm Springs and Indian Wells both pulled back, down 10% and 18% respectively, while Cathedral City, La Quinta, and Coachella posted modest gains.
Bermuda Dunes homes are moving fastest at just 33 days, though that's another small-sample figure. Palm Springs, Cathedral City, and Palm Desert all saw DOM tick down slightly year-over-year, a good sign for sellers there. La Quinta stands out with DOM up 59% to 108 days, and Coachella's DOM more than tripled to 132, though with only 12 sales that swing reflects a handful of listings, not a market-wide slowdown.
If you're considering putting your home on the market, let us help you get it SOLD! Now, more than ever, marketing matters!
Our world-class marketing plan, with online ads, paid YouTube ads, and social media exposure, is critical in this shifting market. Call now for a free seller consultation, and let us help you decide if now is the right time to sell your home.
If you'd like a detailed market report for a specific city, email us and let us know which city reports you'd like to receive.
Call us at ( 760) 409-8811 , or visit TheHamiltonREGroup.com for an easy-to-use home search and information on how we can help you with all your essential real estate needs.
The Hamilton Real Estate Group is evolving to meet all our customers' real estate needs. If you are ready to sell, call or email us, or for a FREE instant home valuation report, click here: What's My Home Worth?
Stay up to date on the latest Coachella Valley news!
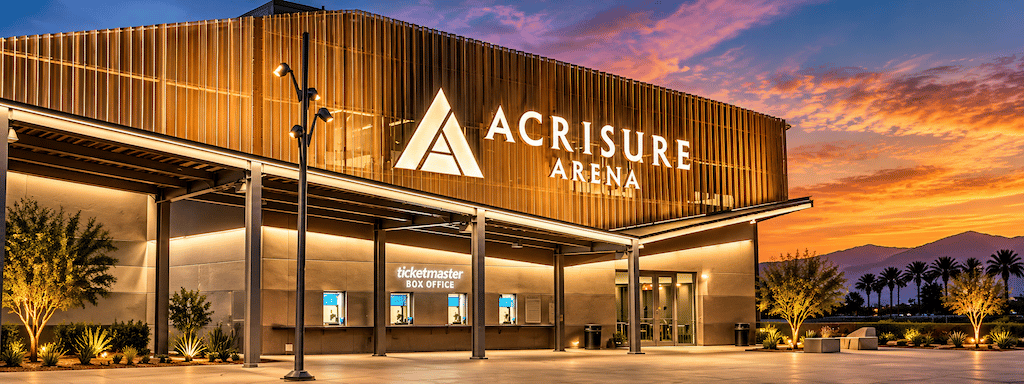
November in the desert brings Pride, the WTA Finals, balloons, Food & Wine and Wildlights, plus comedy, concerts and theater.
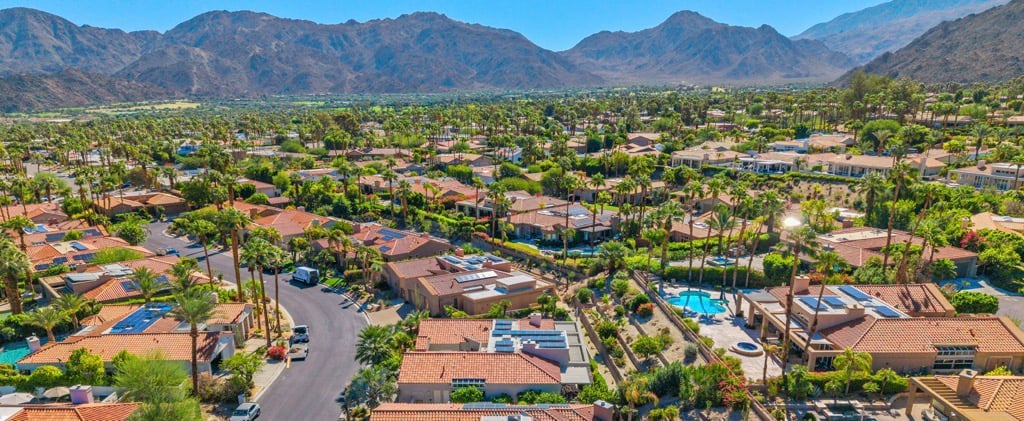
Valley sales fell 15% and inventory tightened in September, while prices held steady as mortgage rates climbed to a near three-year high.
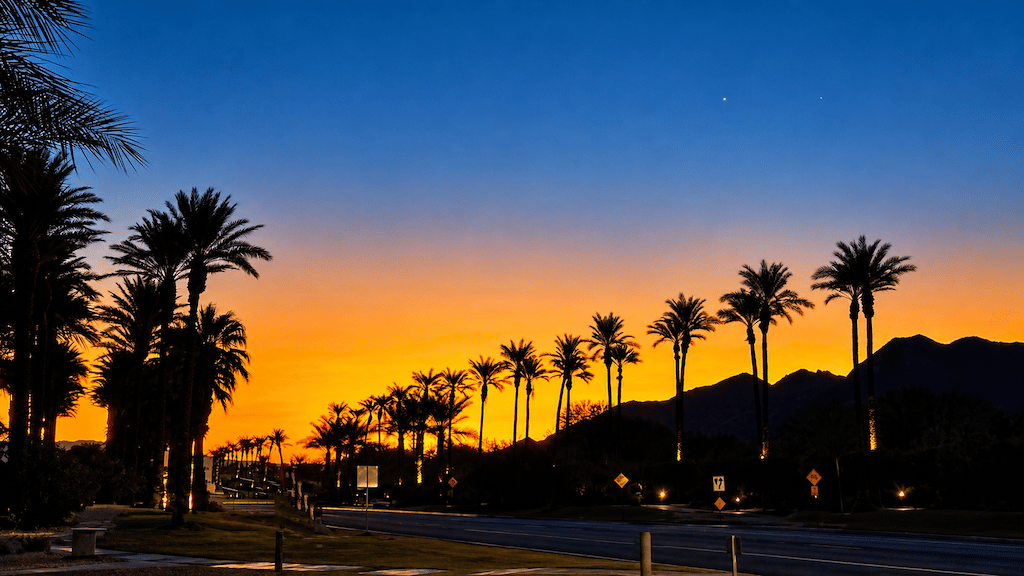
October in the desert brings Modernism Week, Firebirds hockey, live comedy, and a month of Halloween fun. Here is everything worth doing this month.

Coachella Valley sales slowed and days on market stretched in August, but tight inventory and a near 97% sale to list ratio kept pricing power intact.
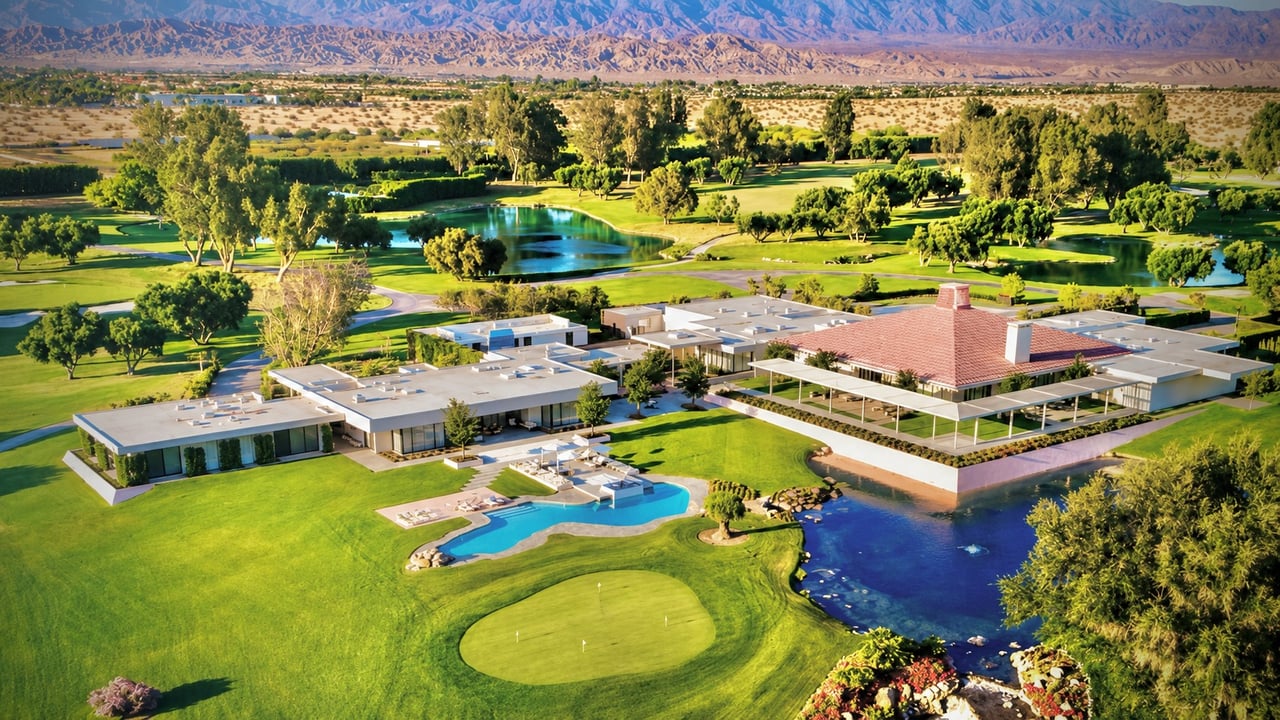
Jazz, film, comedy, and cool pools fill the Coachella Valley this September, plus Sunnylands reopens before winter crowds return.
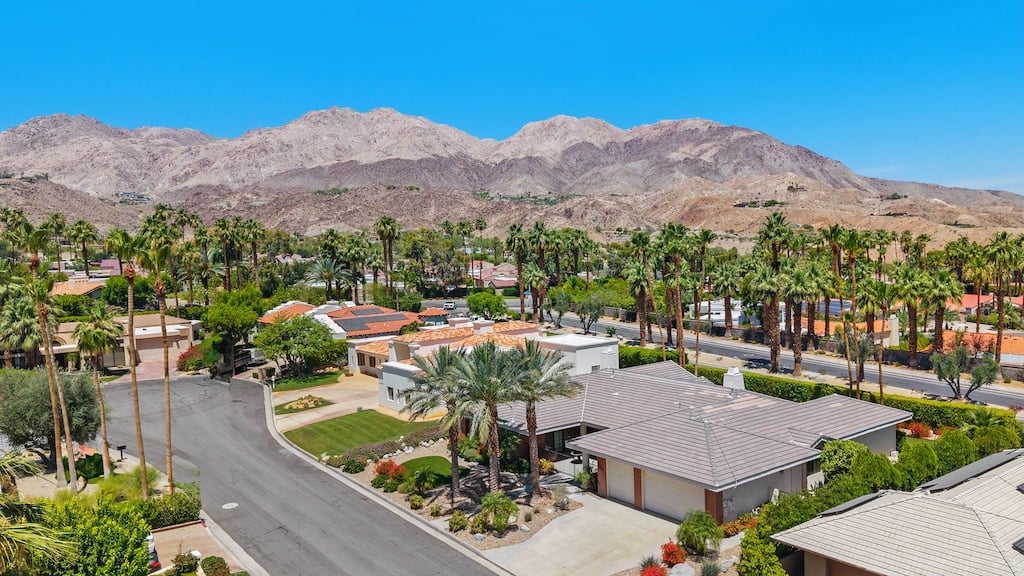
Desert home prices were up in July while sales cooled and inventory tightened, giving sellers the upper hand this fall.
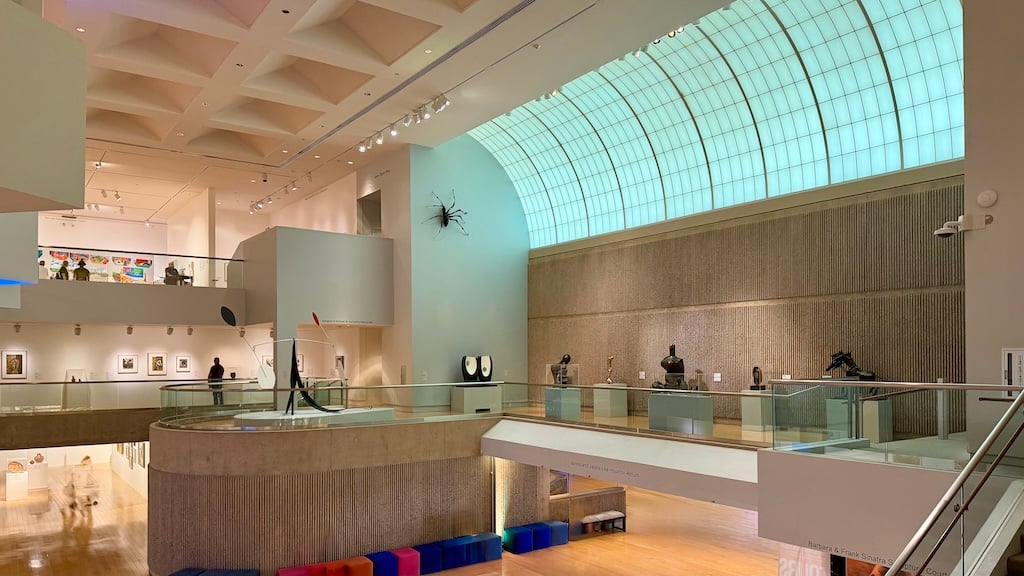
Splash House, Tour de Big Bear, TEDxRanchoMirage, and a Pioneertown meteor shower headline August, alongside live comedy, concerts, and desert art.
Coachella Valley home sales climbed 11% year-over-year in June as inventory tightened and prices leveled off, but homes are sitting longer
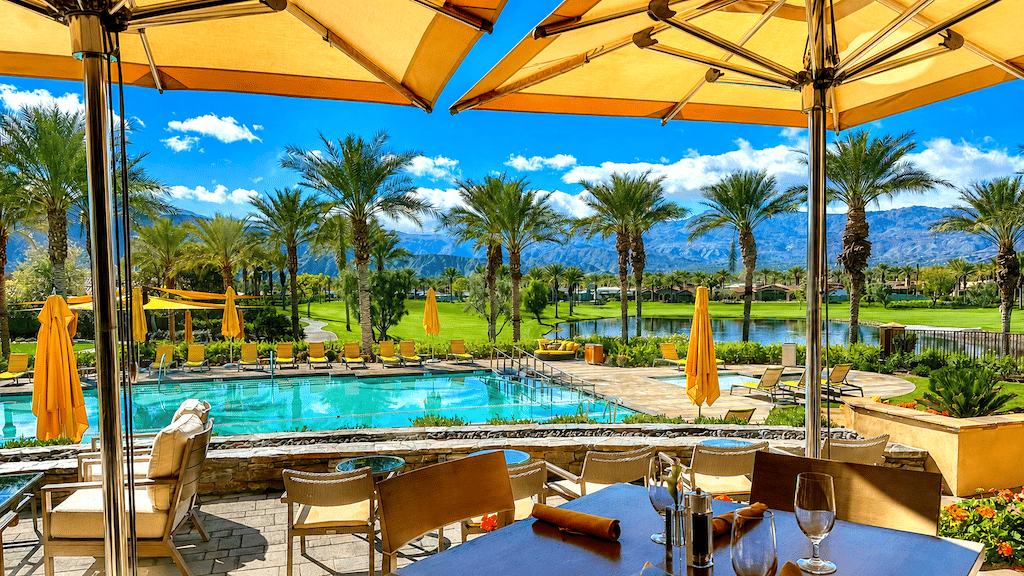
July the Coachella Valley: six July 4th events valley-wide, free concerts, dive-in movies, comedy, art shows & Dancing with the Stars Con
Dan and Reuben of The Hamilton Real Estate Group are here to guide you through a transformative real estate experience. Join us, and let the connection open doors to your next real estate adventure.