Could Steady Prices and Rising Sales Signal a Strengthening Coachella Valley Market?
The Hamilton Real Estate Group March 19, 2026
The Hamilton Real Estate Group March 19, 2026
The Coachella Valley real estate market showed encouraging signs of momentum in February, with closed sales jumping nearly 30% over January and pricing holding steady at both the median and average levels. Inventory continued to tighten compared to a year ago, and sellers remained close to their asking prices — pointing to a market that is active, balanced, and gaining traction as the region moves into its peak season. For buyers and sellers alike, the February data tells a story of a market on solid footing and trending in a positive direction.
February brought 527 closed sales across the Coachella Valley, a robust 29% increase over January's 408 homes sold. However, compared to February 2025's 565 sales, volume remains about 7% below the prior-year pace. While volume is running slightly behind last February's pace, the gap is narrow and consistent with the natural ebb and flow of a healthy, stabilizing market. Sales activity is trending upward as the spring season approaches, and the month-over-month gain suggests buyer momentum may be building.
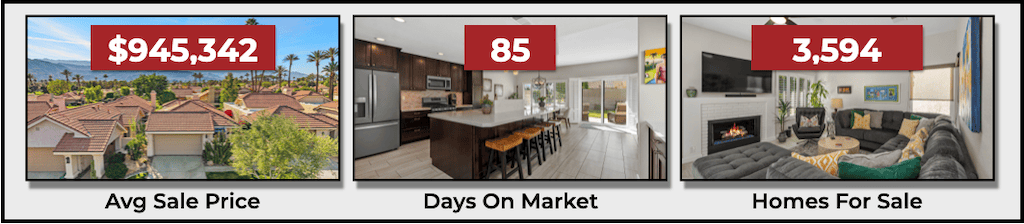
Active inventory at the end of February was at 3,594 homes, down nearly 4% from January and almost 9% below February 2025 levels. The Month's Supply of Inventory (MSI) came in at 6.82 months — a number that signals a relatively balanced market, though modestly favoring buyers. An MSI below 6 typically indicates seller's market conditions; above 7 leans buyer-friendly. At 6.82, neither side holds a dramatic advantage, which creates room for negotiation on both sides.
The average sales price of $945,342 was down 7.6% from January's $1,023,003, but remains 4.7% above February 2025. The median sales price of $619,000 held steady month-over-month and was essentially flat compared to February 2025. The divergence between median and average is worth noting: the median reflects typical buyer activity, while the average is more sensitive to high-end sales. January's elevated average likely reflected strong luxury sales activity last month.
At $389 per square foot in February, this key metric edged down about 5% from January and came in just slightly below the $396 recorded in February 2025. Think of price-per-square-foot as the market's most level playing field — it removes the distortion of home size and property mix, giving a clearer read on where values actually stand. The current reading reflects modest softening, but the year-over-year difference is small and consistent with the kind of seasonal variation we typically see at this time of year.
Homes spent an average of 85 days on market last month— up slightly from 82 in January and notably higher than the 74-day average recorded in February 2025. The year-over-year increase of nearly 15% is the most telling data point here: buyers are taking more time, and sellers need to plan accordingly. Rising DOM is a signal to price competitively from day one, as overpriced listings tend to sit — and sitting listings lose leverage over time.
There were 1,067 new listings last month — down 20% from January's 1,334 and 14% below February 2025's 1,245. The reduction in new listings, combined with a decline in inventory is a bit unusual as we typically seek new listings peak in April before starting their seasonal decline over the summer months.
February's data shows there are still good opportunities for buyers, but as inventory remains near recent-year lows and may start trending downward, buyer’s could start to see fewer options as we move into the the off-season. Days on market are longer than a year ago, giving buyers slightly more time to evaluate — but well-priced, move-in-ready homes are still selling for 97% of list price.
For sellers the message is clear: pricing strategy is everything in this market. With days on market at their highest February level in three years and inventory declining, correctly priced homes will attract attention — but overpriced listings risk sitting in a market that is paying close attention to value. The 97% sales-to-list ratio demonstrates that sellers who price realistically are achieving near full asking price.
Mortgage rates have edged upward in recent weeks, with the 30-year fixed currently averaging approximately 6.21%, the 15-year fixed at around 5.50%, and the 30-year jumbo at approximately 6.45%. While rates remain above the historic lows of recent years, they are considerably more favorable than the peak levels of 2023. Buyers are encouraged to consult with a local lender to explore current options and lock in a rate that aligns with their individual situation.
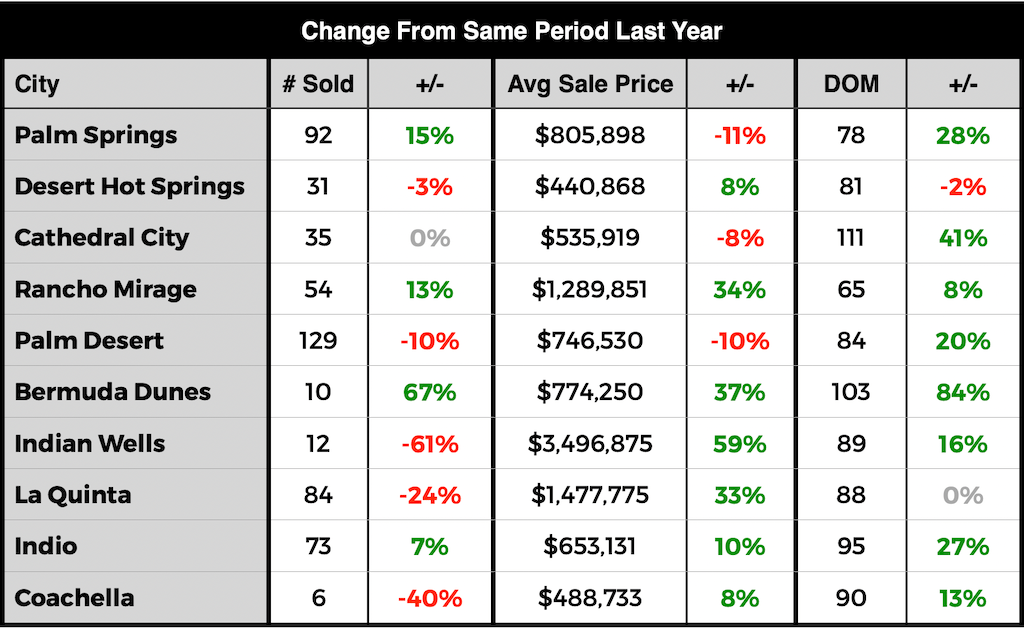
The numbers for each major city in the area provide a clearer view of trends in our market.
Sales volume across the valley was a mixed picture last month, with Bermuda Dunes leading all cities with a remarkable 67% year-over-year gain, followed by Palm Springs at +15% and Rancho Mirage at +13%. Palm Desert remained the highest-volume market with 129 sales, while Indio posted a healthy 7% gain. On the softer side, Indian Wells saw a sharp volume decline, though the limited number of transactions makes year-over-year swings naturally more dramatic. La Quinta and Coachella also trailed prior-year levels.
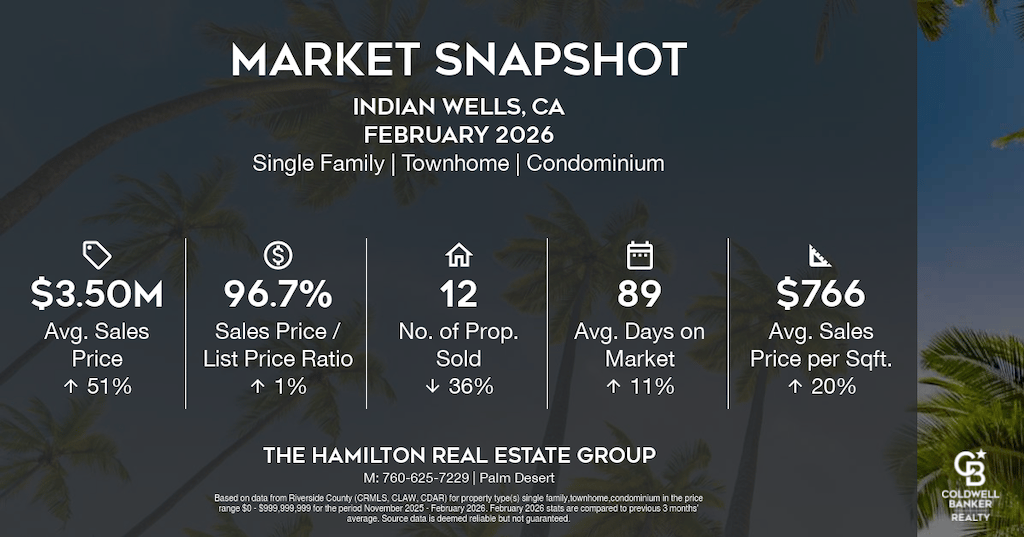
Price appreciation was a standout story in several communities. Indian Wells recorded an average sale price of $3,496,875 — up 59% year-over-year — reflecting strong luxury demand at the valley's upper end. Rancho Mirage and La Quinta also posted impressive gains of 34% and 33% respectively. Bermuda Dunes surged 37% to $774,250. Meanwhile, Palm Springs saw average prices soften 11% and Palm Desert dipped 10%, suggesting price recalibration in those more volume-driven markets.
Homes are taking longer to sell across most of the valley compared to a year ago, with Cathedral City seeing the most significant increase at 41% more days on market, followed by Bermuda Dunes at 84%. Rancho Mirage was the notable bright spot, with homes selling in just 65 days, only 8% above last year's pace. Palm Desert and Indian Wells came in at 84 and 89 days respectively, reflecting the broader valley trend of buyers taking more time before committing.
If you're considering putting your home on the market, let us help you get it SOLD! Now, more than ever, marketing matters! Our world-class marketing plan, with online ads, paid YouTube ads, and social media exposure, is critical in this shifting market. Call now for a free seller consultation, and let us help you decide if now is the right time to sell your home.
If you'd like a detailed market report for a specific city, email us and let us know which city reports you'd like to receive.
Call us at (760) 409-8811, or visit www.thehamiltonregroup.com for an easy-to-use home search and information on how we can help you with all your essential real estate needs.
The Hamilton Real Estate Group is evolving to meet all our customers' real estate needs. If you are ready to sell, call or email us, or for a FREE instant home valuation report, click here: What's My Home Worth?
Copyright © 2026 Hamilton Desert Homes, LLC. All rights reserved.
Stay up to date on the latest Coachella Valley news!
Coachella Valley home sales climbed 11% year-over-year in June as inventory tightened and prices leveled off, but homes are sitting longer
July the Coachella Valley: six July 4th events valley-wide, free concerts, dive-in movies, comedy, art shows & Dancing with the Stars Con
Valley home values held near two-year highs in May as inventory fell 17% from last year and new listings hit their lowest level since 2024.

Art festivals, Bob Dylan, ShortFest, Juneteenth, comedy icons, and outdoor movies — June in the desert is anything but quiet.

April sales climbed nearly 8% year-over-year as inventory tightened and prices moderated — a Coachella Valley market finding its footing.
Firebirds playoffs, film noir, Joshua Tree music, and Marilyn Monroe's 100th birthday — May in Greater Palm Springs doesn't slow down.
March sales hit a 3-year high as 733 Coachella Valley homes sold — up 11% year-over-year — while inventory tightened and the market gained momentum.

Coachella, Stagecoach, Desert Rodeo, Broadway, playoff hockey, and more — April in the Coachella Valley has a lot going on. Here's your guide.
The Coachella Valley real estate market gained momentum in February, with sales surging 30% and pricing holding steady as spring season approaches.
Dan and Reuben of The Hamilton Real Estate Group are here to guide you through a transformative real estate experience. Join us, and let the connection open doors to your next real estate adventure.