
A Balanced Market Begins to Emerge in The Coachella Valley
The Hamilton Real Estate Group December 15, 2025
The Hamilton Real Estate Group December 15, 2025
The Coachella Valley real estate market is gradually becoming more balanced as the year progresses. Recent data indicates consistent buyer activity, stable pricing, and more predictable timelines for well-positioned homes. While the pace has moderated from recent highs, the underlying fundamentals remain strong, creating opportunities for both buyers and sellers who approach the market with clarity, strategy, and realistic expectations.
In November 2025, a total of 432 homes were sold across the Coachella Valley. This represented a decrease of approximately 16 percent compared to October 2025. Despite the month-over-month slowdown, sales activity was notably stronger than the same period last year, increasing nearly 14 percent from the 380 homes sold in November 2024. This year-over-year improvement reflects sustained demand and renewed buyer confidence as seasonal residents return to the desert.
At the end of November, there were 3,296 homes actively listed for sale. This represents a slight decline from October 2025, down about 2 percent, and was more than 5 percent lower than November 2024. While inventory levels remain sufficient to offer buyers a range of options, the gradual decrease in available homes indicates a positive shift in the balance between supply and demand.
Home prices in November demonstrated remarkable resilience, especially in the higher price ranges of the market. The average sale price reached $880,218, marking an increase of nearly 11 percent from October 2025 and more than 5 percent higher than November 2024. The median sale price finished the month at $583,750, reflecting a modest 1 percent increase from the prior month, though approximately 3 percent lower than the median price recorded one year ago. This spread between average and median pricing indicates continued strength in luxury and higher-priced properties while more affordable segments remain value-driven.
Homes spent an average of 81 days on the market in November. Compared to November 2024 average days on market increased by nearly 16 percent, reflecting a more deliberate and analytical buyer pool that rewards well-priced, well-presented homes.
New listing activity slowed in November, with 924 properties coming to market during the month. This was a notable decline of nearly 29 percent from October 2025 and approximately 18 percent fewer new listings than in November 2024. This seasonal pullback in new inventory is typical for this time of year and we typically see new listings rebound at the start of the new year.
For buyers, increased days on market and stable inventory levels provide them with more time to evaluate options, conduct due diligence, and negotiate terms. Buyers who are prepared and well-informed can take advantage of pricing opportunities, particularly in the lower price segments where sellers are motivated and competition is more measured.
For sellers, the market continues to reward strategic pricing, strong presentation, and professional marketing. While buyers are more deliberate than they were a year ago, the resilience of pricing, particularly in higher-end properties, and the improvement in seasonal demand contribute to the success of homes that are properly positioned. Sellers who align their pricing with current market conditions remain well positioned to attract qualified buyers.
Mortgage interest rates remain relatively stable. The average 30-year fixed rate is currently hovering around 6.2% to 6.4%, while 15-year fixed loans are generally ranging between 5.5% and 5.8%, appealing to buyers focused on faster equity growth. 30-year fixed jumbo rates are slightly higher, typically falling between 6.4% and 6.6%, yet remain competitive for higher-value purchases.
The numbers for each major city in the area give a better view of the trends in our market.
Across the major cities of the Coachella Valley, home sales showed generally positive year-over-year momentum. Palm Desert led in overall volume with 101 homes sold, a modest 4 percent decline from last year, while Palm Springs recorded 70 sales, up 11 percent. La Quinta and Indio posted solid gains with increases of 9 percent and 30 percent, and Indian Wells stood out with a 55 percent rise in sales, reflecting renewed activity in the luxury segment.
Average sale prices highlight a market increasingly defined by location and price tier. Indian Wells remained the highest-priced market with an average sale price of approximately $2.49 million, up 13 percent from last year. La Quinta and Bermuda Dunes experienced substantial appreciation, with prices rising 43 percent and 45 percent respectively, while Palm Springs saw a healthy 7 percent increase. By contrast, Rancho Mirage, Palm Desert, Cathedral City, and Coachella experienced moderate year-over-year price declines.
Days on market increased across most Coachella Valley cities. Bermuda Dunes experienced the largest change, with average days on market rising to 136 days. Palm Springs averaged 91 days on market, while Palm Desert, Indian Wells, and La Quinta clustered in the high-80-day range. Rancho Mirage stood out as an exception, with average days on market declining to 49 days.
If you're considering putting your home on the market, let us help you get it SOLD! Now, more than ever, marketing matters! Our world-class marketing plan, with online ads, paid YouTube ads, and social media exposure, is critical in this shifting market. Call now for a free seller consultation, and let us help you decide if now is the right time to sell your home.
Stay up to date on the latest Coachella Valley news!
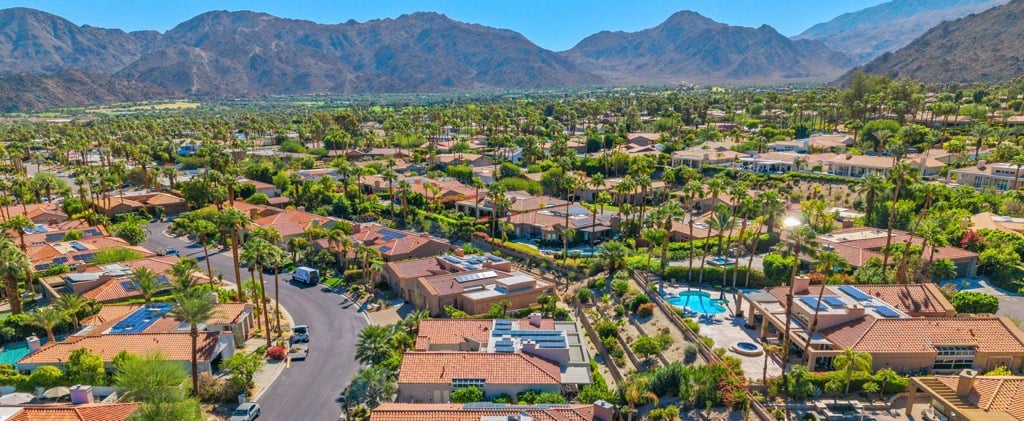
Valley sales fell 15% and inventory tightened in September, while prices held steady as mortgage rates climbed to a near three-year high.
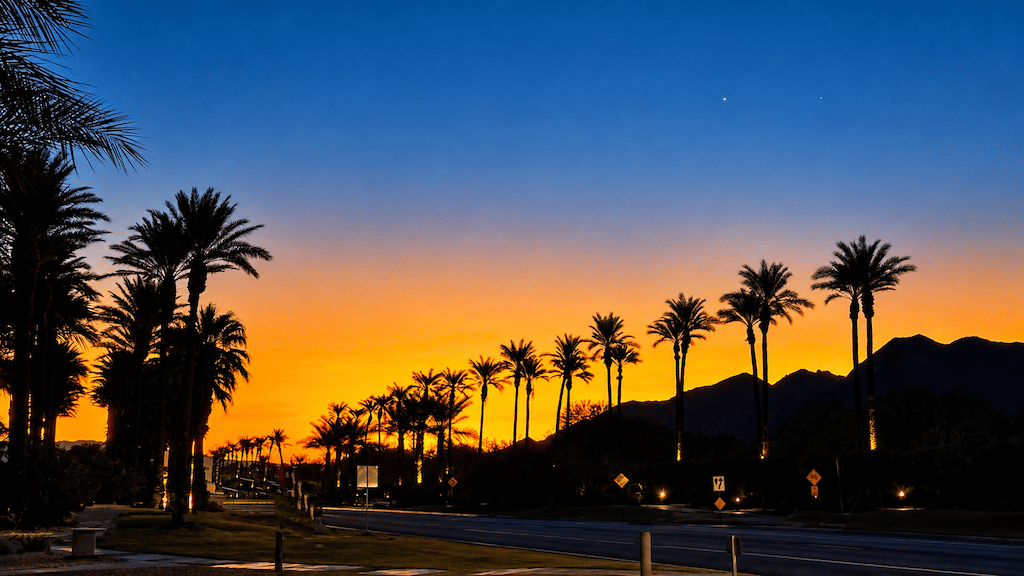
October in the desert brings Modernism Week, Firebirds hockey, live comedy, and a month of Halloween fun. Here is everything worth doing this month.

Coachella Valley sales slowed and days on market stretched in August, but tight inventory and a near 97% sale to list ratio kept pricing power intact.
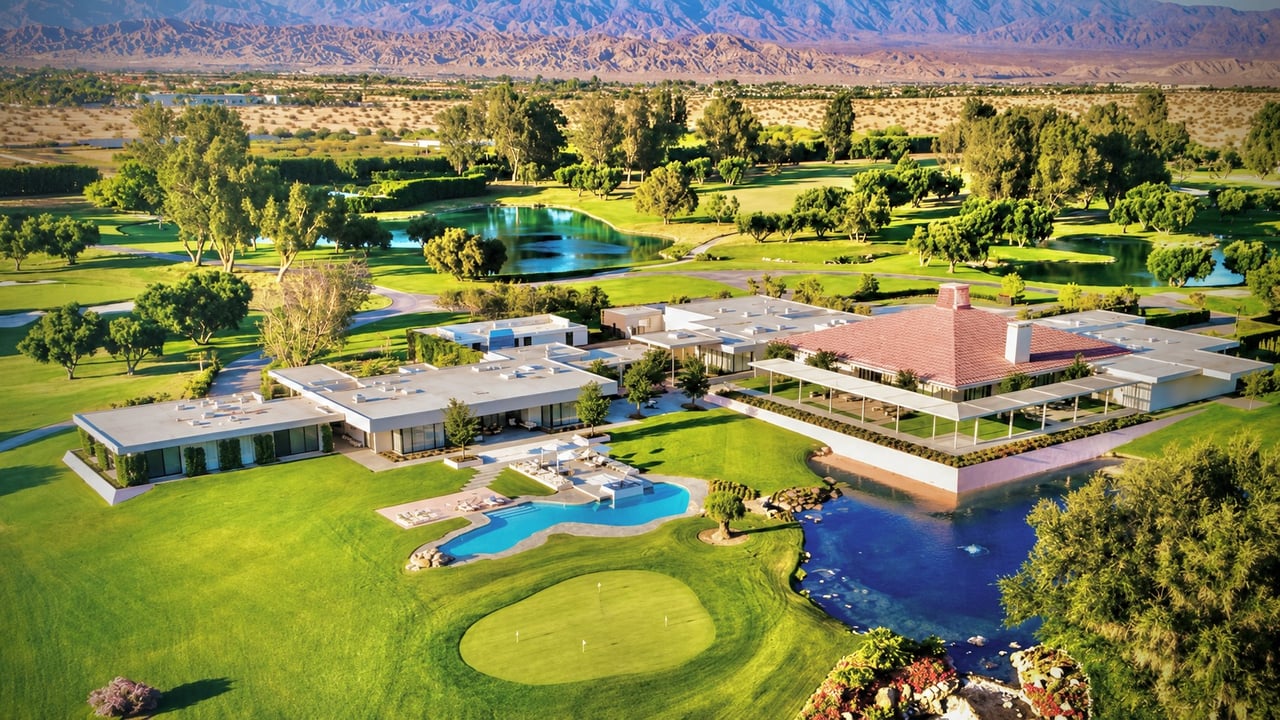
Jazz, film, comedy, and cool pools fill the Coachella Valley this September, plus Sunnylands reopens before winter crowds return.
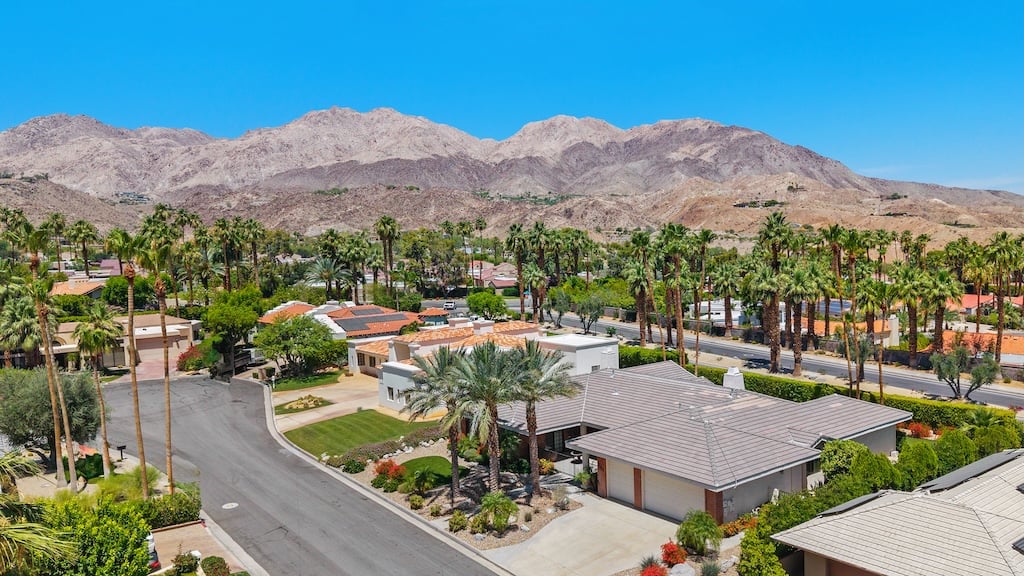
Desert home prices were up in July while sales cooled and inventory tightened, giving sellers the upper hand this fall.
Splash House, Tour de Big Bear, TEDxRanchoMirage, and a Pioneertown meteor shower headline August, alongside live comedy, concerts, and desert art.
Coachella Valley home sales climbed 11% year-over-year in June as inventory tightened and prices leveled off, but homes are sitting longer
July the Coachella Valley: six July 4th events valley-wide, free concerts, dive-in movies, comedy, art shows & Dancing with the Stars Con
Valley home values held near two-year highs in May as inventory fell 17% from last year and new listings hit their lowest level since 2024.
Dan and Reuben of The Hamilton Real Estate Group are here to guide you through a transformative real estate experience. Join us, and let the connection open doors to your next real estate adventure.


